What Does 1 Million Business Expenses Look Like Today?
Two and a half years ago we launched the first version of our app with the goal of creating a smarter and better way for companies to manage their business spend, and today more than 1 million expenses have been created in TravelBank.
To put into perspective just how many expenses we’ve processed, one million receipts is about 180 feet tall, and approximately the height of an 18 story building or the Statue of Liberty!
Innovation for a Better Expense Management Experience
Previously, the expense space had been stagnant with little innovation. The major players had been around for at least a decade, and despite new digital technology, expensing was still a very manual process.
TravelBank emerged and has quickly grown to address the inefficiencies and needs of the expense management experience. Over the past two and a half years, we released dozens of new features and product updates in an effort to develop the best expense tracking software, and received some exciting awards and recognition along the way.
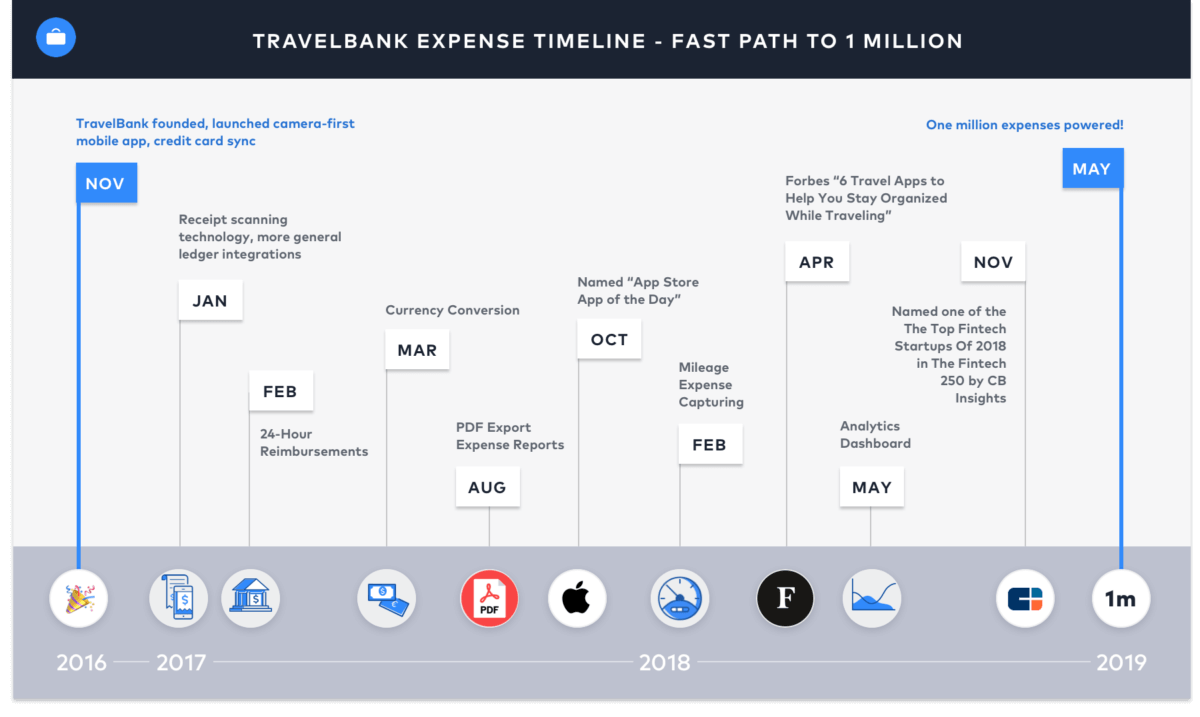
It all started in October 2016 when the TravelBank app launched in the Apple App Store and Google Play Store. We debuted a camera-first mobile app, allowing employees to track receipts on-the-go and cutting the time it took to create an expense report drastically.
In 2017, our receipt scanning technology introduced a faster and more secure process for capturing expenses. Just one month later we rolled out 24-hour reimbursements, getting employee’s money back in their pockets sooner than ever, and then in March we introduced currency conversion for more than 150 currencies to be automatically converted to US dollars. In the fall of 2017, our iOS app was named App of the Day in the App Store.
In 2018, major additions to the expense management functionalities of the TravelBank app included mileage expense tracking, and an analytics dashboard for admin users. In the spring Forbes named TravelBank one of 6 Travel Apps to Help You Stay Organized While Traveling, and in the fall CB Insights named us one of the The Top Fintech Startups Of 2018 in The Fintech 250.
Our innovations are focused on improving the user experience and supplying an intuitive, mobile-first UX that allows employees to be more productive and track expenses on-the-go. Technology has allowed many of the tedious, manual tasks involved with expense reporting and management to be automated, and TravelBank takes it one step further than most expense tracking app, by providing an all-in-one travel and expense management platform for a seamless business travel experience.
So, what does 1 million business expenses look like?
The Top 10 Merchants Expensed
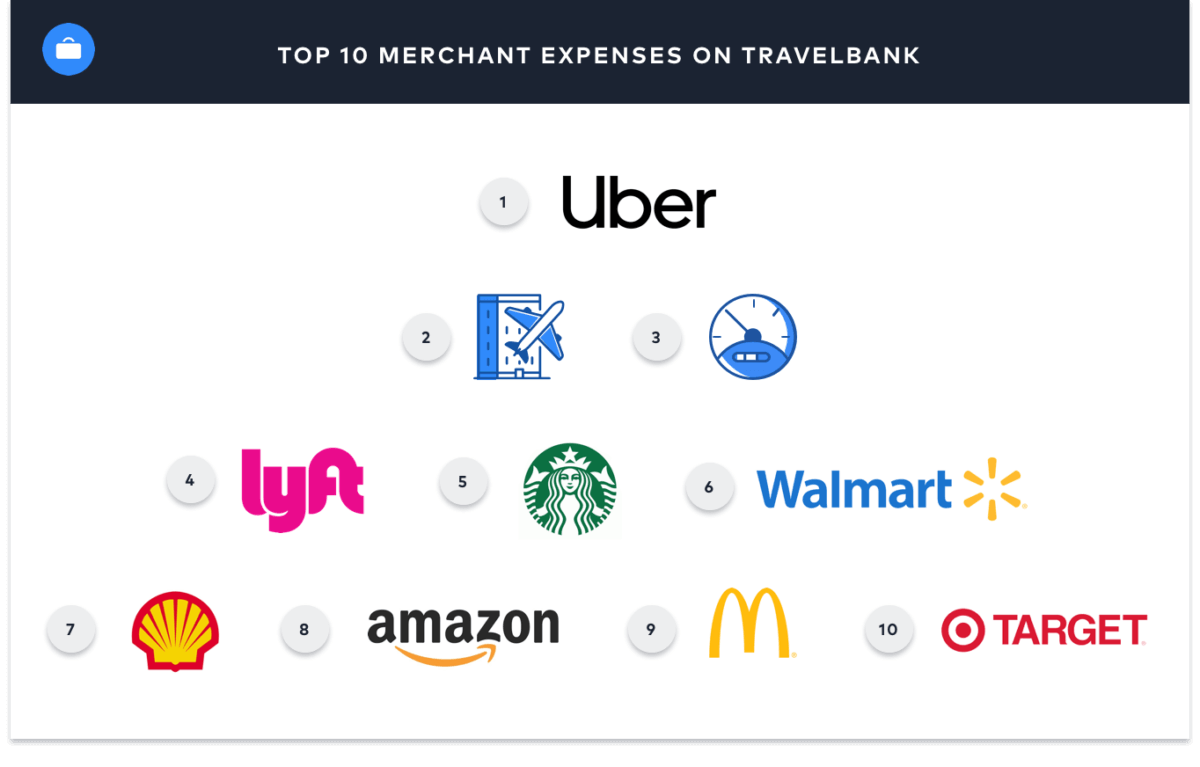
In analyzing over one million expenses, we looked at the merchants our business travel users expensed the most over the past two and a half years to determine how business travelers are spending the company dime.
Ridesharing is Still on the Rise
In the top spot, Uber was expensed most frequently by our business travelers. Lyft isn’t far behind in the number four spot, and seeing both of the ridesharing apps in the top five, confirms that ridesharing continues to grow in popularity with business travelers.
Business Travelers Spend to Stay on the Road
The second most expensed merchant is TravelBank, accounting for the flights and hotels that business travelers book through our app. Just behind that is “mileage” accounting for the mileage employees are logging on their personal vehicles for work.
In Need of a Caffeine Boost
In the number five spot, Starbucks still has a hold over business travelers who likely need a fast and reliable cup of caffeine on-the-go, despite growing popularity of new, trendy coffee shops popping up in most cities.
Top Merchants by Category
Air
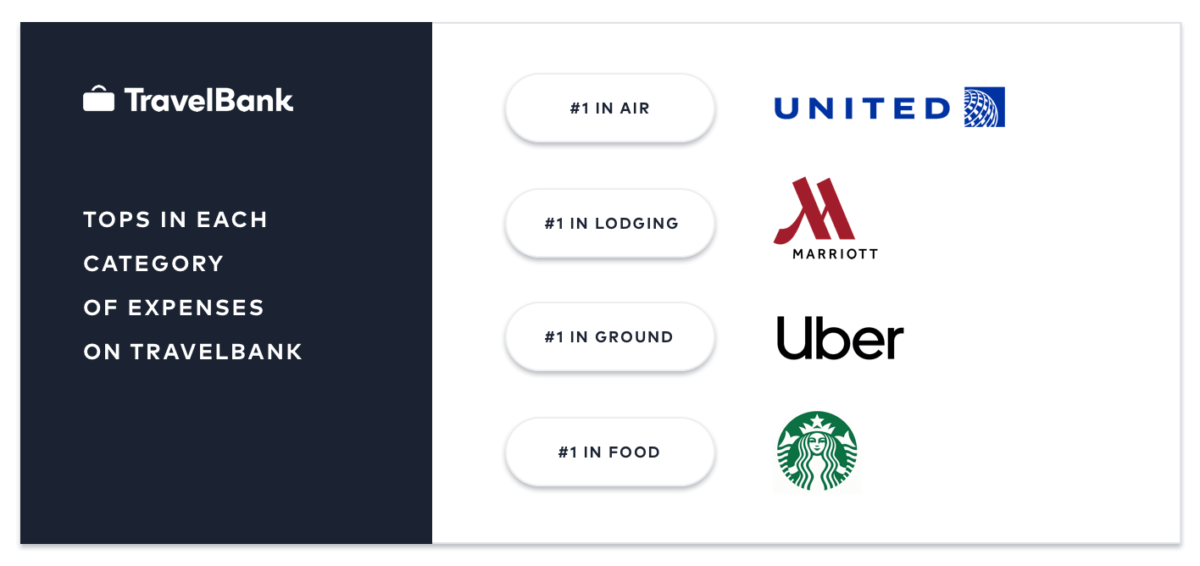
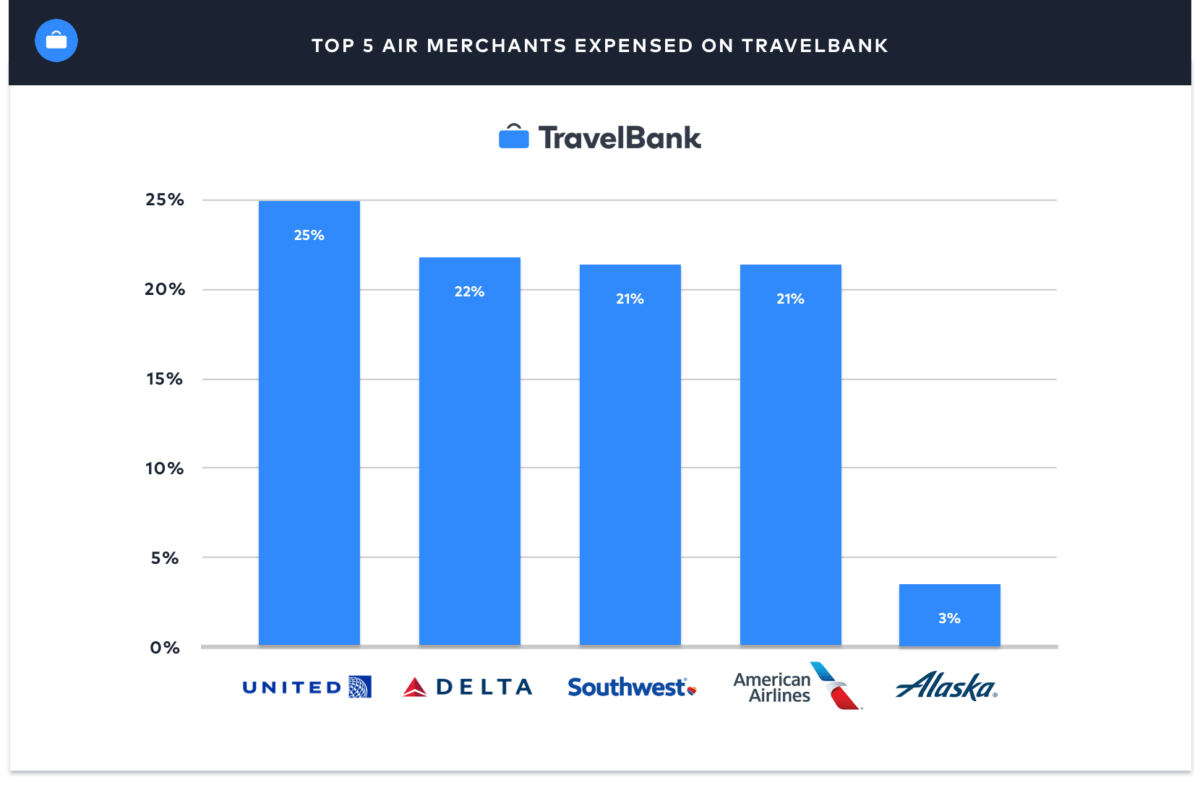
Most business trips start with a flight. Of the many expenses process in this category, United emerged as the number one merchant expensed. The Management Consulted team ranks United highly for its inflight experience which could be a deciding factor when booking cross-country routes frequented by business travelers. Following closely behind are Delta, Southwest, and American, which all also ranked in the top five for the U.S News list of the best airlines rewards programs. Alaska, which bought Virgin America for $2.6 billion in 2016 and ranks number one on the U.S. News list for airlines rewards programs slips into the number five spot.
Lodging
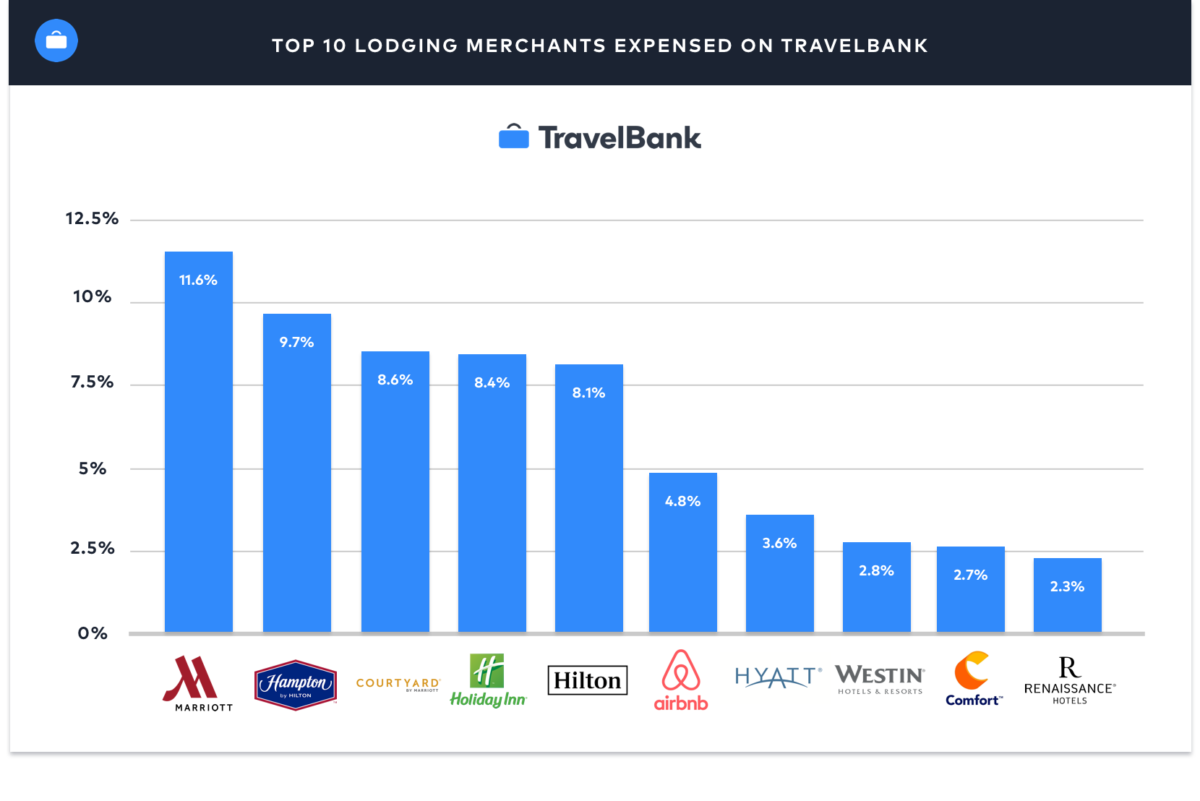
Marriott hotels were the most expensed merchant for lodging, followed by other well known hotel properties including Hampton Inn, Courtyard by Marriott, Holiday Inn, and Hilton. Similarly the sharing economy trends we are seeing in ground transportation, Airbnb cinches the number six spot for the lodging category. The launch of Airbnb for work and a “work trip” filter make it easier for business travelers to find a vacation rental that suits their business needs and book a reliable lodging option.
Ground
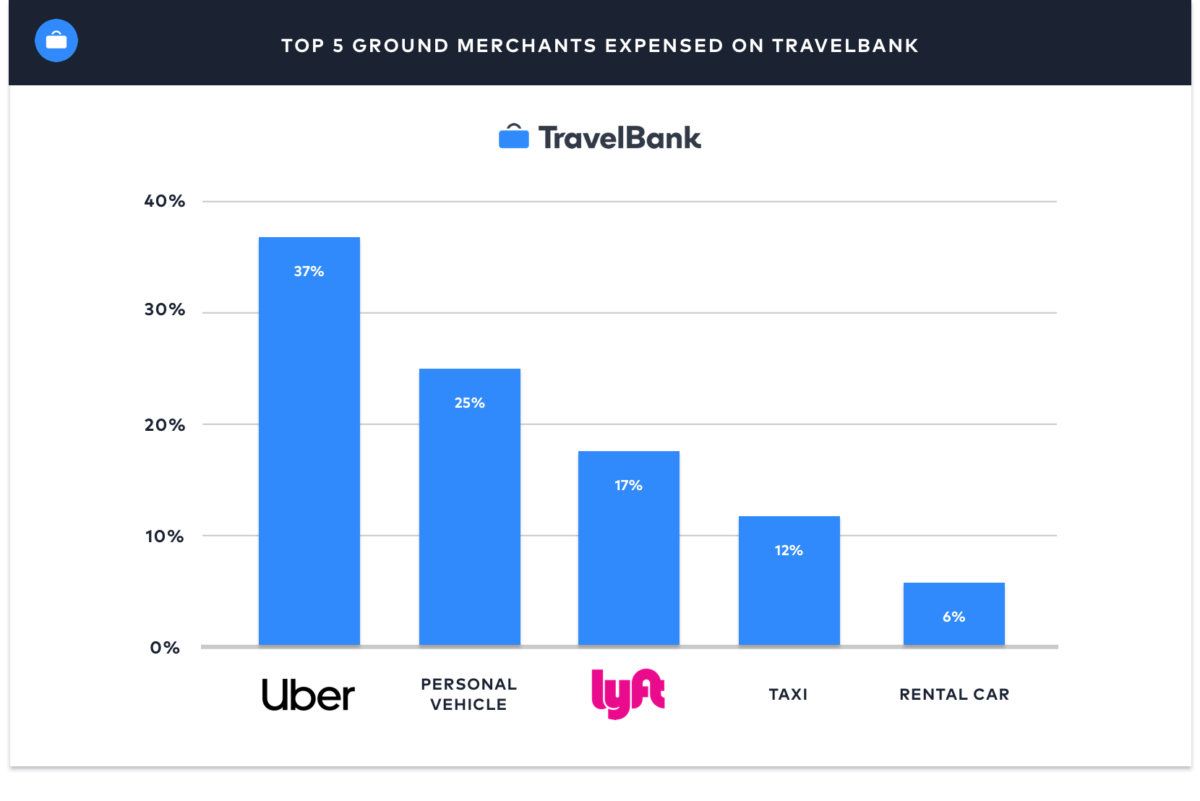
Reflecting what we saw in the top ten merchants across all expenses, Uber holds the crown, accounting for 37% of expenses tracked in the ground transportation category, followed again by “mileage” at 25% and Lyft at 17%. Taxis still account for 12% of expenses in this category, and rentals cars 6%. Of the rental cars expensed, the top five merchants were Hertz accounting for 28%, National (22%), Enterprise (18%), Avis (14%), and Budget (8%).
Food
As seen in our top ten merchants expensed overall, Starbucks and McDonald’s bring in the top number of expenses for all food merchants, followed by Taco Bell, KFC, Subway, Chick-fil-A, Dunkin’ Donuts, Chipotle, Whole Food, and Panera.
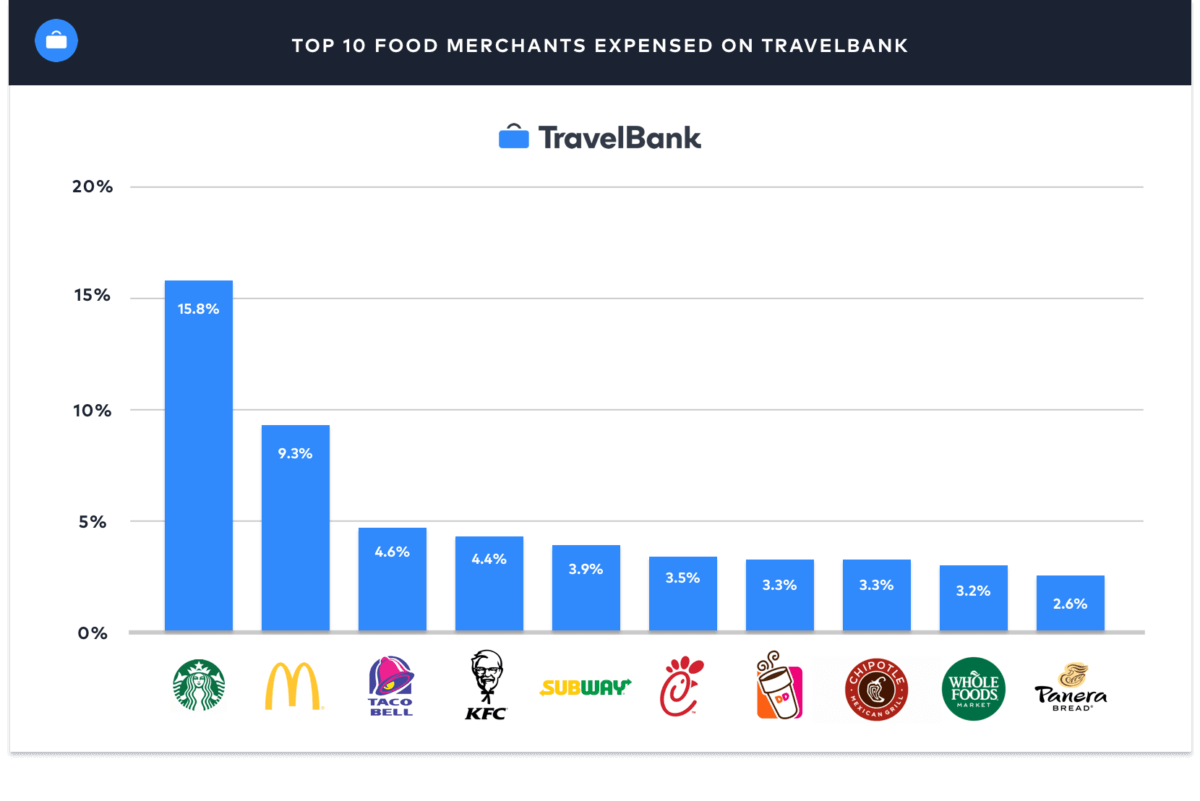
The strong presence of quick service restaurant brands and fast food chains seems a reflection of the busy pace of business travel, though some brands known for marketing healthier options snuck into the top ten. While being the largest fast food chain in American, according to QSR Magazine, Subway only cinches the number five spot. Chick-fil-A on the other hand, is only the 21st largest fast food chain in the country and takes the number 6 spot on our list of top merchants expensed for the food category.
| Rank | TravelBank Data | QSR Magazine Rack |
|---|---|---|
| 1 | Starbucks | Subway |
| 2 | McDonald's | McDonald's |
| 3 | Taco Bell | Starbucks |
| 4 | KFC | Dunkin' Donuts |
| 5 | Subway | Pizza Hut |
| 6 | Chick-fil-A | Burger King |
| 7 | Dunkin' Donuts | Taco Bell |
| 8 | Chipotle | Wendy's |
| 9 | Panera Bread | Domino's |
| 10 | Burger King | Dairy Queen |
| 11 | Wendy's | Little Caesar's |
| 12 | Arby's | KFC |
| 13 | Popeyes | Sonic |
| 14 | Jimmy John's | Arby's |
| 15 | Panda Express | Papa John's |
| 16 | Whataburger | Jimmy John's |
| 17 | Pizza Hut | Baskin-Robbins |
| 18 | Bojangles | Chipotle |
| 19 | Potbelly | Jack in the Box |
| 20 | Dairy Queen | Popeye's |
| 21 | Sonic | Chick-fil-A |
| 22 | Shake Shack | Panera |
| 23 | In-N-Out Burger | Panda Express |
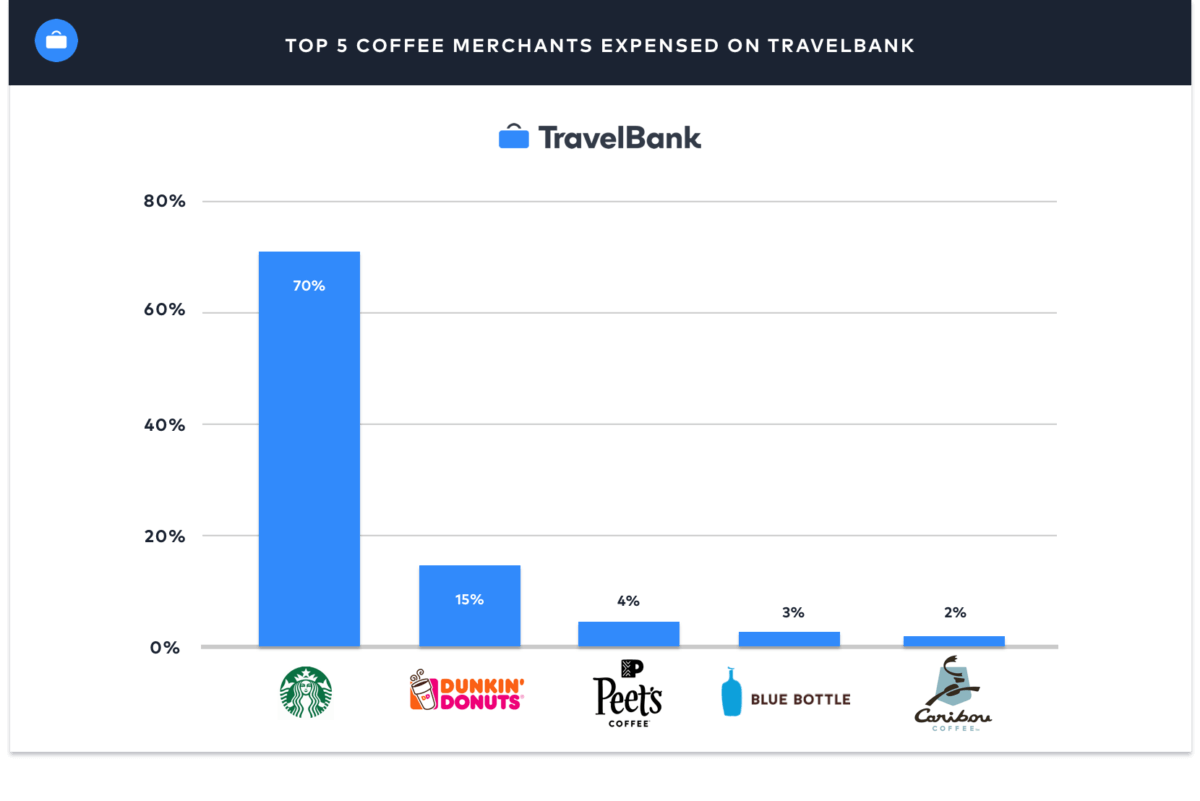
Seeing as Starbucks by far accounted for the most expenses in the food category, we took a deeper look at other coffee shops frequented by business travelers. While hip, west coast favorites like Peet’s and Blue Bottle make the list, Starbucks still holds over 3 times more expenses recorded than the other top 5 merchants combined.
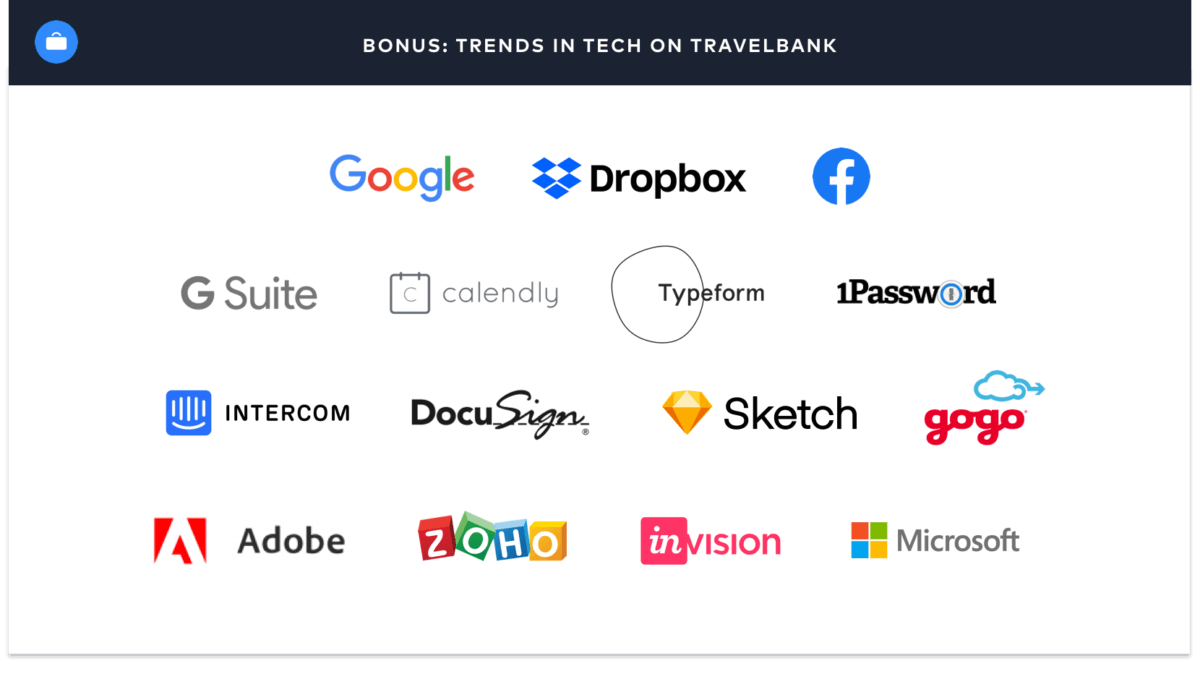
Spotlight on Tech, Software and Services
By providing expense management services, TravelBank is focused on taking care of the tracking so our customers can focus on growing their businesses. One thing we like to keep an eye out for are trends in the technology, software, and services being expensed by our customer base. What else is powering their business? Here are 15 software and services companies we’ve noticed getting expensed quite a bit lately.
Methodology
TravelBank analyzed the merchants recorded for over one million expenses processed through the TravelBank app by users. Additionally, expenses were grouped by category to identify the top merchants in the following four categories: air, lodging, ground transportation, and food.


