


21 T&E KPIs We Track for Reporting
Only 9% of respondents think their method of measuring AP metrics and KPIs is extremely effective. 😱 Meanwhile, every year, TravelBank samples and analyzes hundreds of thousands of travel bookings and expense reports submitted on our platform. It’s made possible by user-friendly and granular insights into spend, without having to manually blend data from an ERP, random receipts, and corporate cards. Here are the 21 T&E KPIs we use for reporting.
Table of Contents
Travel Bookings Trends
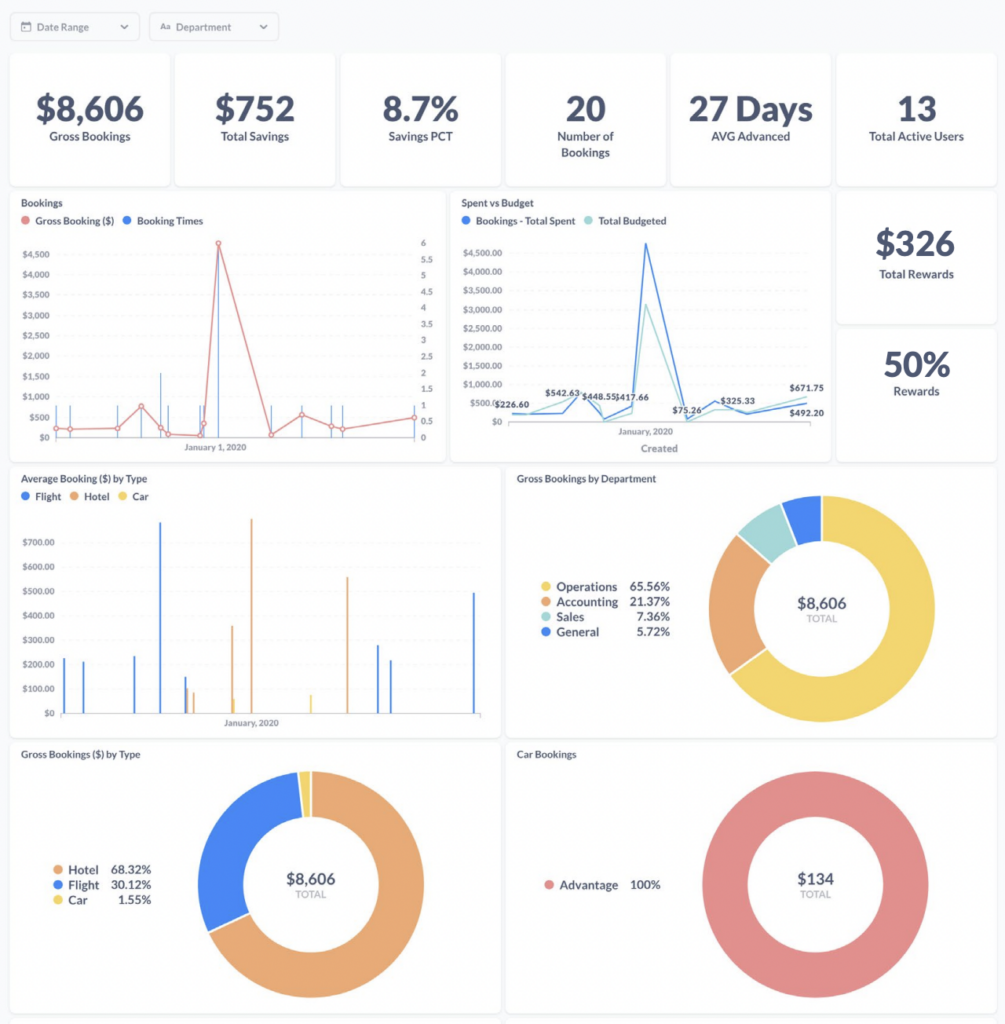
Data visualizations for the win! At a glance, we’re tracking many T&E KPIs at once. With this view you can:
- Track gross booking costs, total booking numbers, and how spend compares to budget.
- Monitor and improve how far in advance employees book travel.
- Visualize how bookings are spread across departments, geographies, and employee titles.
- Discern how bookings are split across flights vs. hotels vs. rental cars.
- And – if you’re using incentives – see how much employees are saving by making smarter choices.
Flight Bookings

Trip details reveal a lot of T&E KPIs. They’re especially helpful when discerning:
- When employees should be flying, driving, or taking a train.
- The most common travel routes and destinations.
- The duration of each trip.
- If there’s been any change fees.
- If flights are under- or over-budget.
Expense Report Trends
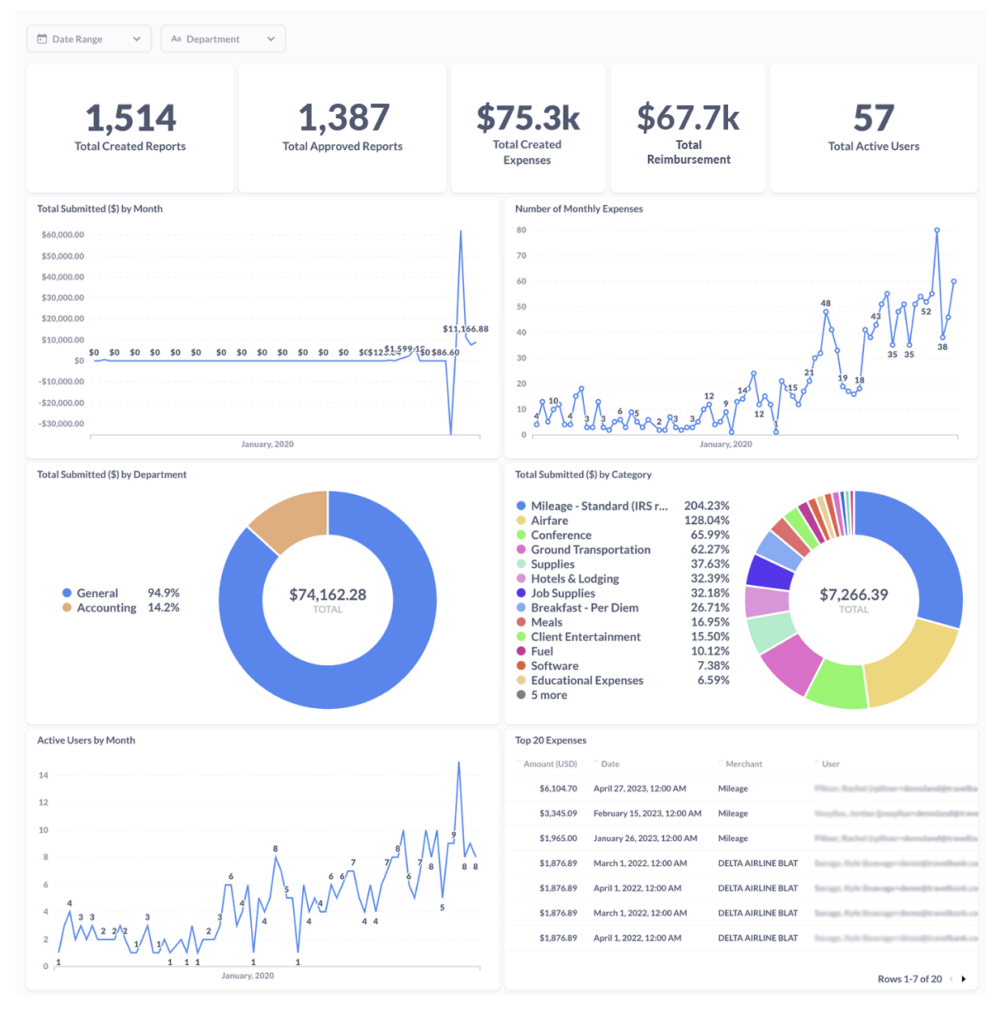
At a glance, we see:
- The total and monthly trends of expense report volumes, and the seasonal highs and lows.
- The ratio of created vs. approved reports, particularly what large expenses have been created but not yet approved.
- How bookings are spread across departments. Does it match expectations and responsibilities?
- What merchants and categories are most common (and therefore the focus of your T&E policies)
- And top expenses at a glance – where are the largest chunks of your money’s going? Are they being spent wisely?
Credit Card Reconciliation
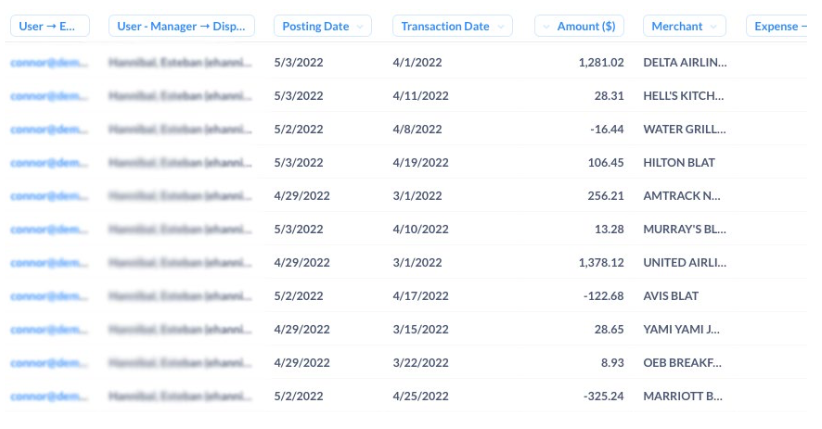
Consider this your crystal ball. You can see transaction costs and dates across all users and merchants, before expense reports are created or submitted. This is especially helpful during heavy PTO seasons like summer and winter holidays, when your T&E KPIs could easily get distorted.
Expense Reports Created but Not Submitted (Accrual)
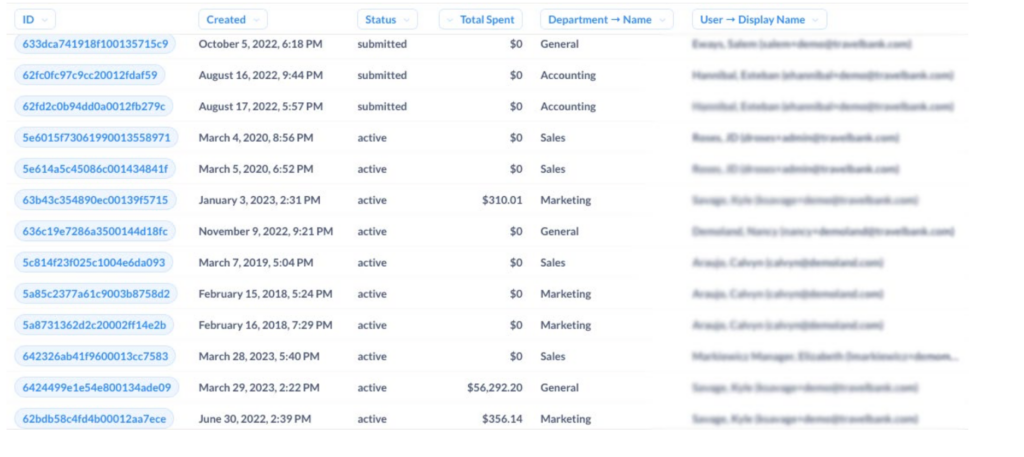
With this KPI, you can quickly accrue future travel and expenses by department, and see which reports are drafted, but not yet submitted. A game changer when closing each month.
How Often Do You Report T&E KPIs?
We recommend analyzing all 21 of these T&E KPIs quarterly, not monthly. Why? Because month-to-month can be very lumpy.
Holiday seasons, major conferences, even back-to-school all create peaks and valleys. Quarterly reporting gives you a more stable data set.
Reclaim 15% of Your Time with TravelBank
T&E management will never “spark joy.” But Accounting shouldn’t suffer through antiquated processes or tools.
- Manually processing expense reports costs $26 in person-power, per report. TravelBank reduces that cost to <$7.
- A recent study conducted by Forrester Consulting found that TravelBank trimmed 15% of the time spent approving requests and creating reports. For many accounting teams, that’s a massive efficiency.
- TravelBank customers report saving 5-10 hours/month on reconciliation alone.
