

Highlights from the 2024 State of Business T&E Report
What does business T&E look like in 2024? In our newest report, TravelBank selected and analyzed travel bookings and over 300,000 random expense reports submitted on our platform from July 1, 2023 through June 30, 2024. By comparing these expenses to previous years, we tracked the evolution of how employees travel, do business, and go to work.
The results surprised us:
- General merchandise retailers – Amazon, Walmart, Costco, Target, etc. – are now the most commonly expensed merchants.
- Food delivery apps (and their fees) are now more common than in-restaurant meals.
- Fewer business travelers are opting for budget hotels or flights.
- Personal vehicles and ridesharing continue to dominate ground travel.
Table of Contents
The Most Expensed Merchants Overall
Uber has been the most expensed merchant for three reports in a row, but this year they are joined by Lyft in #2. And general merchandise retailers are now expensed more often than meals, hotel stays, and air travel.
| Rank | Most Expensed Merchants in 2024 | Most Expensed Merchants in 2023 |
|---|---|---|
| 1 | Uber | Uber |
| 2 | Lyft ↑ | Delta Air Lines |
| 3 | Amazon ↑ | Starbucks |
| 4 | Starbucks ↓ | Amazon |
| 5 | Delta Air Lines ↓ | The Home Depot |
| 6 | Marriott ↑ | American Airlines |
| 7 | American Airlines ↓ | Lyft |
| 8 | United Airlines ↑ | Home2 Suites by Hilton |
| 9 | The Home Depot ↓ | Marriott |
| 10 | Walmart ↑ | Candlewood Suites |
All told, 2024 is shaping up to be the year of the autonomous business traveler.
Retail
Amazon was expensed more than 2x any other retailer. Along with Walmart, Costco, Target, and Best Buy, employees are supplying their own needs without the hassles or delays (or bulk discounts) of official procurement. We were interested to also see CVS and Walgreens (#11) so high on the list.
| Rank | Most Expensed General Retailers in 2024 |
|---|---|
| 1 | Amazon |
| 2 | The Home Depot |
| 3 | Walmart |
| 4 | Costco |
| 5 | Hudson News |
| 6 | Target |
| 7 | Lowe’s |
| 8 | Grainger |
| 9 | CVS |
| 10 | Best Buy |
>> Related: How to Adapt to the Surge of Expenses from Amazon & Walmart <<
Ground
In 2019, personal vehicles were used in just 25% of trips. But since the pandemic, the share of personal vehicle usage burgeoned to 64% of ground transportation expenses in 2023, and continues to hold firm at 63% in 2024. This trend is cementing: most business travelers use their own cars and expense gas and mileage.
| Rank | Share in 2024 | |
|---|---|---|
| 1 | Personal vehicle | 63% |
| 2 | Uber | 20% |
| 3 | Rental car | 11% |
| 4 | Lyft | 5% |
| 5 | Taxi | 2% |
Among ground merchants, the car rental market for business travelers remains dwarfed by ride sharing apps:
| Rank | Share in 2024 | |
|---|---|---|
| 1 | Uber | 60.15% |
| 2 | Lyft | 17.74% |
| 3 | National Car Rental | 6.41% |
| 4 | MTA | 3.98% |
| 5 | Curb Taxi App | 2.80% |
| 6 | Avis | 2.64% |
| 7 | Hertz | 2.44% |
| 8 | Enterprise Rent-A-Car | 2.23% |
| 9 | Various Limousine Services | 1.2% |
| 10 | Amtrak | 0.41% |
Uber continues to monopolize the ground transportation market, with 3x the share of #2 Lyft. New this year, the MTA (New York’s Metropolitan Transportation Authority) and taxi app Curb had bigger market shares than any car rental merchant except National. And limos proved more popular than Amtrak.
>> Related: 11 T&E Dashboards & Reports to Uncover Insights <<
Meals
For the second year in a row, Starbucks was the top eatery for business meals, and was more common than eateries 2-4 combined.
| Rank | Popularity in 2024 | Popularity in 2023 |
|---|---|---|
| 1 | Starbucks | Starbucks |
| 2 | Uber Eats ↑ | McDonald’s |
| 3 | McDonald’s ↓ | Chick-fil-A |
| 4 | Chick-fil-A ↓ | Uber Eats |
| 5 | Dunkin’ | Dunkin’ |
| 6 | Chipotle Mexican Grill ↑ | Hooters |
| 7 | Wendy’s | Wendy’s |
| 8 | Hooters ↓ | Chipotle Mexican Grill |
| 9 | H-E-B ↑ | Publix |
| 10 | Publix ↓ | Wawa |
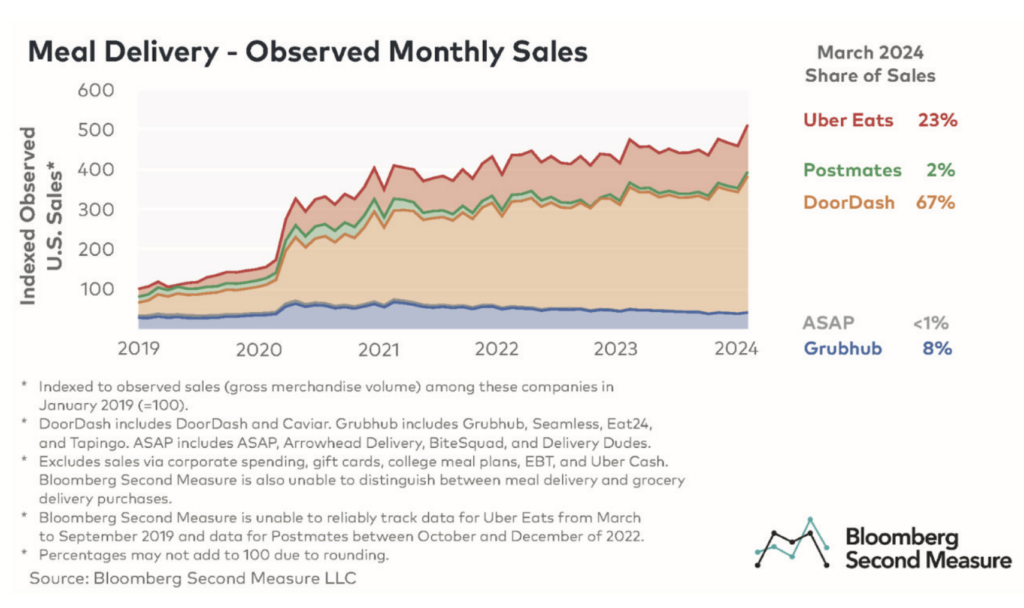
But this year, UberEats became the second most popular merchant for business meals. And UberEats enjoys outsized popularity among business travelers, whereas DoorDash has 67% of market share among the general U.S. population: